Note
Go to the end to download the full example code.
Model Geometry
At any point during model creation, you can run the opstool.vis.pyvista.plot_model() function to visualize the current model’s geometric details.
This function operates based on post-processed data saved during the modeling process, ensuring accurate visualization.
You can use opstool.vis.pyvista.plot_model() anywhere within your model script.
It reads the predefined data, such as nodes and elements, and generates a visual representation of the model.
import opstool as opst
import opstool.vis.pyvista as opsvis
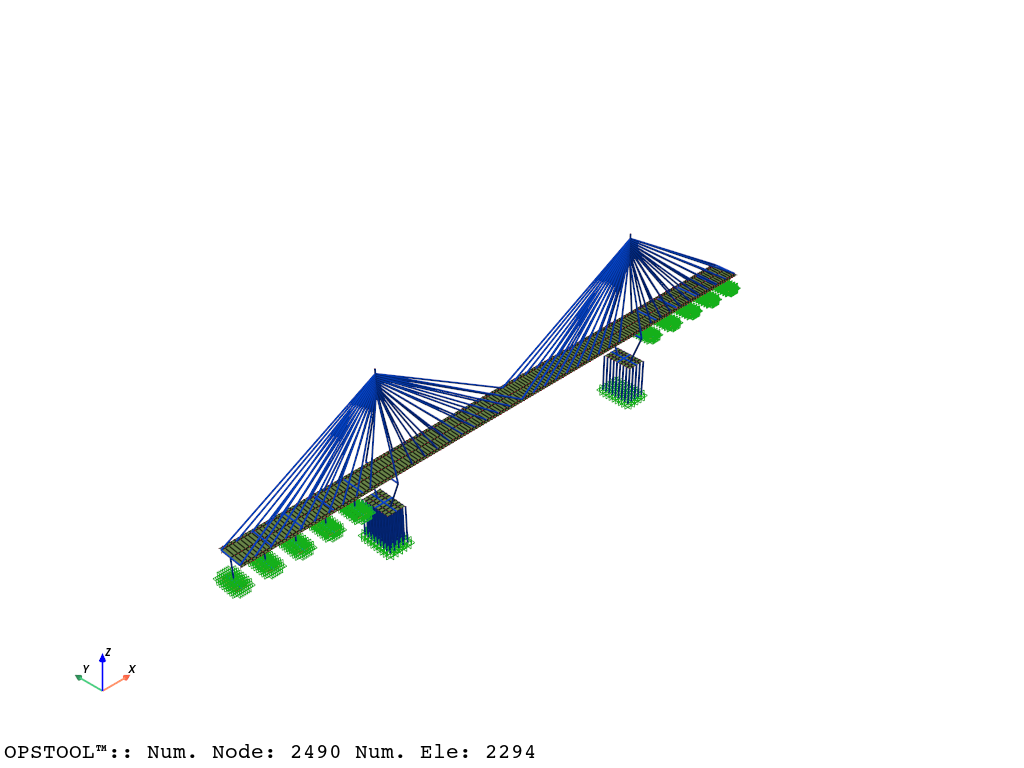
Here, we use a built-in example from opstool, which is an example of a cable-stayed bridge model primarily composed of frame elements and shell elements.
For your own model script, simply place the opstool.vis.plotly.plot_model() function anywhere you need visualization.
A Bridge Example
opst.load_ops_examples("CableStayedBridge")
# or your model code here
quick plot
plotter = opsvis.plot_model()
plotter.show()
Saving Model Data
We can first save the model geometry data by assigning a unique label to the result database using the parameter odb_tag.
This label is used to identify the data.
For more details, see opstool.post.save_model_data().
opst.post.save_model_data(odb_tag=1)
OPSTOOL™ :: Model data has been saved to G:\opstool\docs\.opstool.output/ModelData-1.zarr!
Visualization
We use the opstool.vis.pyvista.set_plot_props() function to predefine some common visualization properties, which will affect all subsequent visualizations of models, eigenvalues, and responses.
.. Note:
If you are not working in Jupyter Notebook or JupyterLab, ensure that **notebook=False**.
opsvis.set_plot_props(point_size=0, line_width=3, notebook=True)
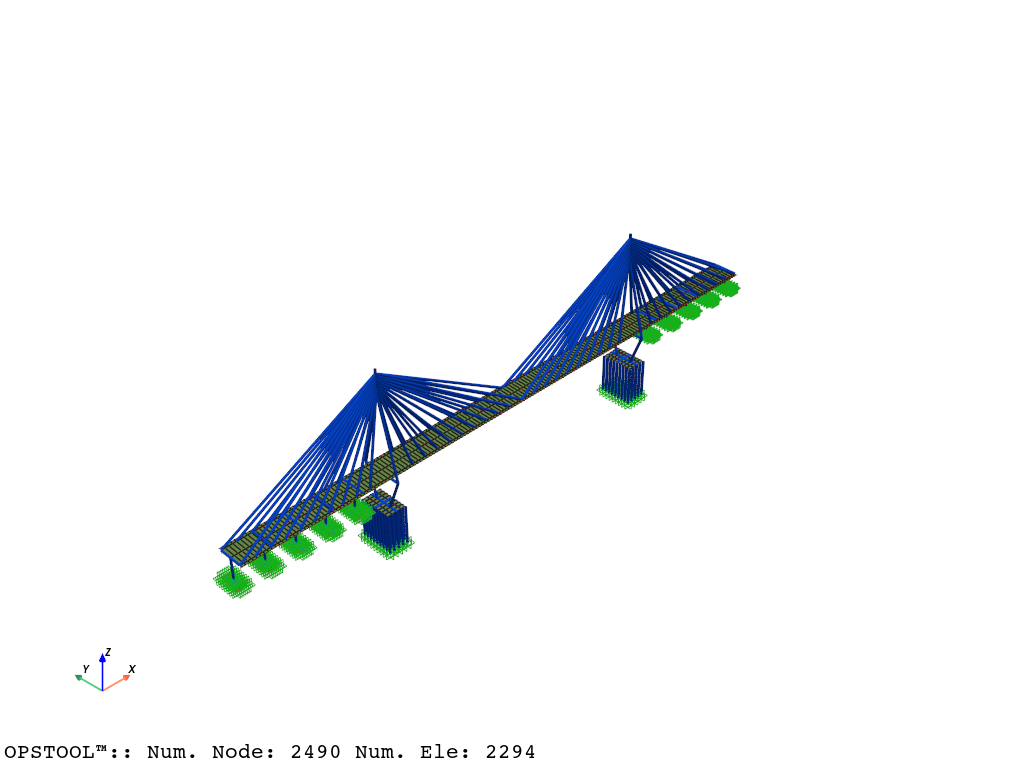
Visualization is straightforward; simply call the opstool.vis.pyvista.plot_model() function.
The odb_tag parameter helps you identify which dataset to use.
For details on various parameters, refer to the opstool.vis.pyvista.plot_model().
plotter = opsvis.plot_model(odb_tag=1)
plotter.show()
OPSTOOL™ ::  Loading model data from G:\opstool\docs\.opstool.output/ModelData-1.zarr ...
Widget(value='<iframe src="http://localhost:64039/index.html?ui=P_0x2a3a230bc50_0&reconnect=auto" class="pyvista" style="width: 99%; height: 600px; border: 1px solid rgb(221,221,221);"></iframe>')
The function opstool.vis.pyvista.plot_model() returns a pyvista.Plotter. object, which you can visualize using the show method.
You can use Plotter.show. to display the plotting window.
You can also use Plotter.export_html. to export this plotter as an interactive scene to an HTML file.
Total running time of the script: (0 minutes 1.753 seconds)