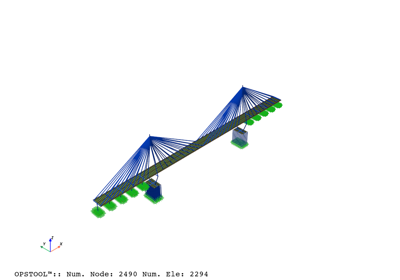
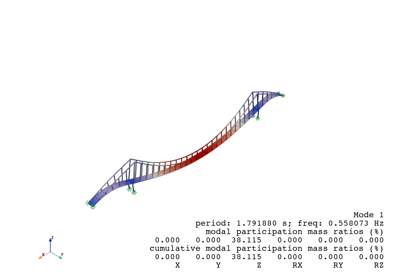
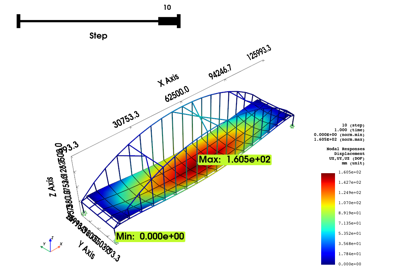
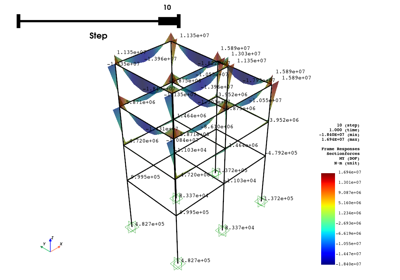
Visualization
The opstool currently offers two engines for visualizing models and responses,
each with its own strengths and weaknesses.
Both engines are custom-tailored to provide nearly identical visualization functionalities for OpenSeesPy.
Supports all response types available in the post-processing modules.
Tip
In Plotly, only surface rendering is supported. As a result, solid elements like tetrahedra and hexahedra are visualized using triangulated meshes, meaning that Plotly does not natively support solid meshes as PyVista does.
Important
If your model is large or you are demonstrating a dynamic analysis with a very large number of steps,
do not use Plotly’s slide module or attempt to create animations, as it will be extremely slow.
Ensure that slides=False.
With these two engines, opstool ensures flexibility and robust visualization options
tailored for OpenSeesPy users, enabling effective analysis and presentation of structural models and
simulation results.
Plotyly-Based Visualization
Refer to the module opstool.vis.plotly for details.


Pyvista-Based Visualization
Refer to the module opstool.vis.pyvista for details.