Fast model and eigenvalue visualization#
opstool provides functions plot_model and plot_eigen to quickly plot model and eigenmodes.
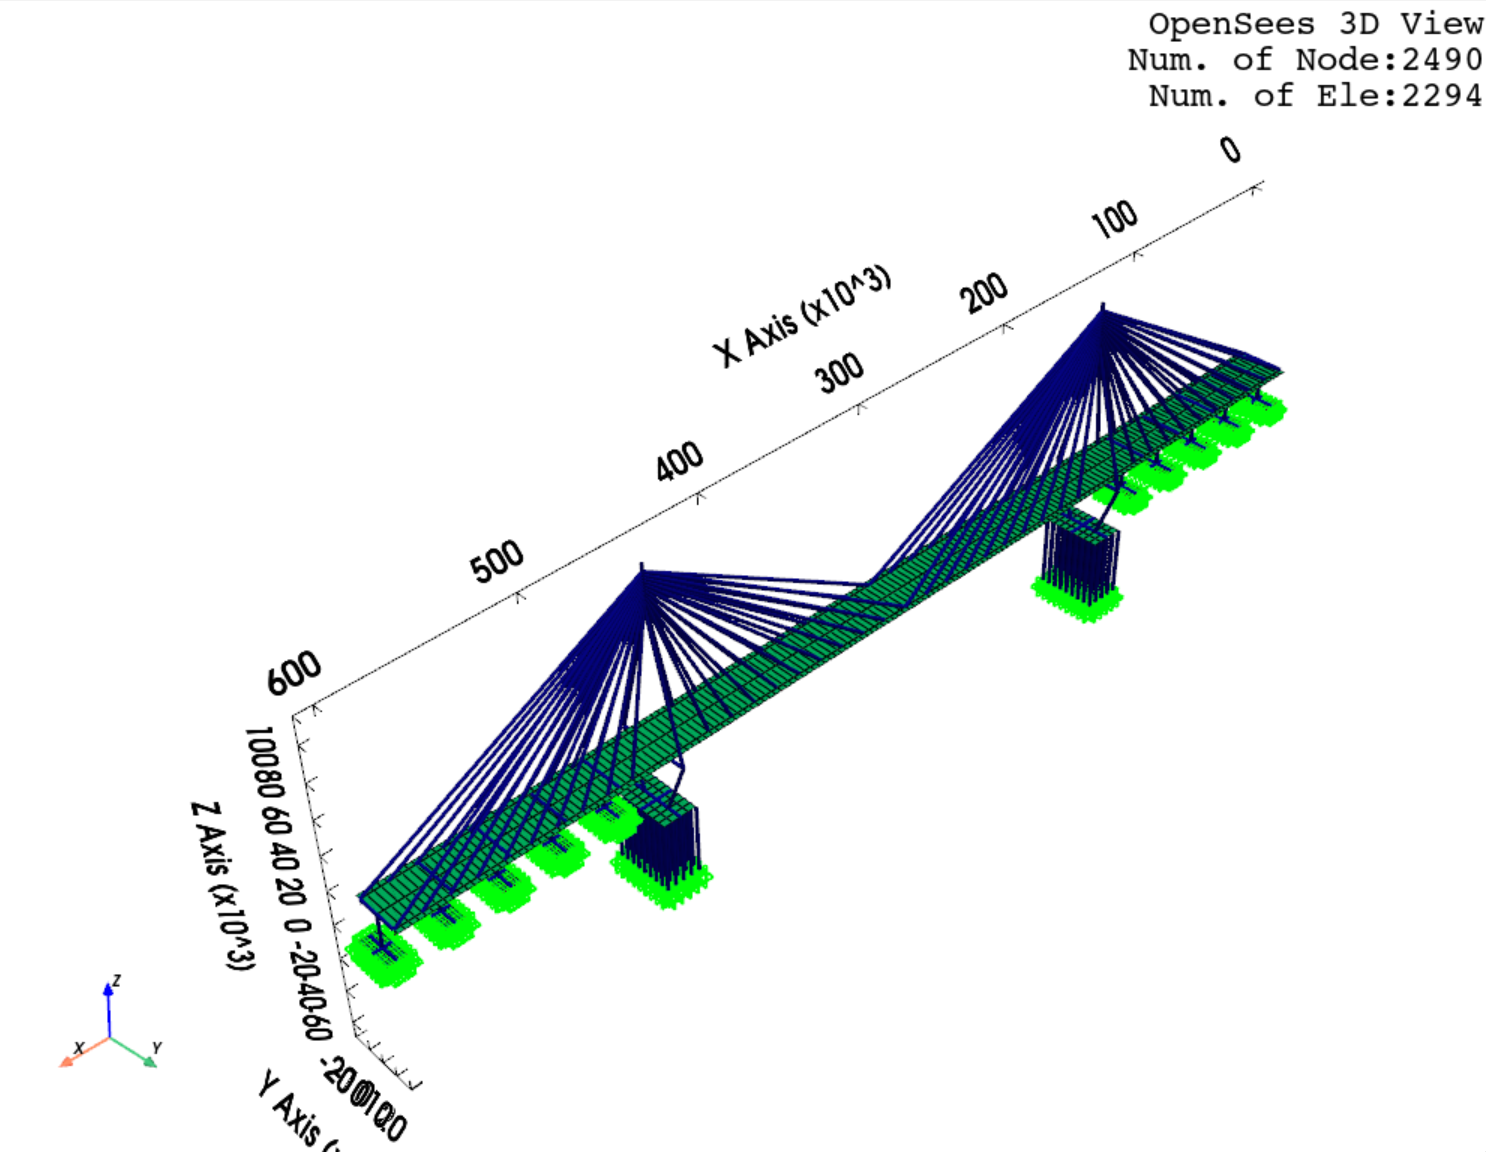
plot_model#
- opstool.vis.plot_model(backend='pyvista', point_size=1, line_width=3, colors_dict=None, on_notebook=False, show_node_label=False, show_ele_label=False, show_local_crd=False, show_local_crd_shell=False, local_crd_alpha=1.0, show_fix_node=True, fix_node_alpha=1.0, show_load=False, load_alpha=1.0, show_constrain_dof=False, label_size=8, show_outline=True, opacity=1.0)[source]#
Plot model quickly.
Parameters#
- backendstr, optional “pyvista”, “plotly” or “matplotlib”.
Plot backend, by default “pyvista”. Note that “matplotlib” is only supported for 2D.
- point_size: float, default=1
The render size of node.
- line_width: float, default=3
The width of line element.
- colors_dict: dict,
The dict for ele color, default color you can see by the class attribute
default_colors.- on_notebook: bool, default=False
Whether work in a notebook.
- show_node_label: bool, default=False
Whether to display the node label.
- show_ele_label: bool, default=False
Whether to display the ele label.
- show_local_crd: bool, default=False
Whether to display the local axes of beam and link elements.
- show_local_crd_shell: bool, default=False
Whether to display the local axes of shell elements.
- local_crd_alpha: float, default=1.0
On existing displays, the scaling factor for the local axis sizes.
- show_fix_node: bool, default=True
Whether to display the fix nodes.
- fix_node_alpha: float, default=1.0
On existing displays, the scaling factor for the boundary symbol sizes.
- show_load: bool, default = False
Whether to display node and beam element loads. The sizes of the arrow are related to the size of its load. If you want to further control the size, you can use load_alpha. Currently only supported beam element load types include <beamUniform2D, beamUniform3D, beamPoint2D, beamPoint3D>.
Note
Please make sure that all dofs (or directions) have values when adding the
loadoreleLoadcommand, even if the value is 0.- load_alpha: float, default = 1.0
On existing displays, the scaling factor for the load arrow sizes.
- show_constrain_dof: bool, default=False
Whether to display labels for constrained degrees of freedom.
- label_size: float, default=8
The foontsize of node and ele label.
- show_outline: bool, default=True
Whether to show the axis frame.
- opacity: float, default=1.0
Plane and solid element transparency.
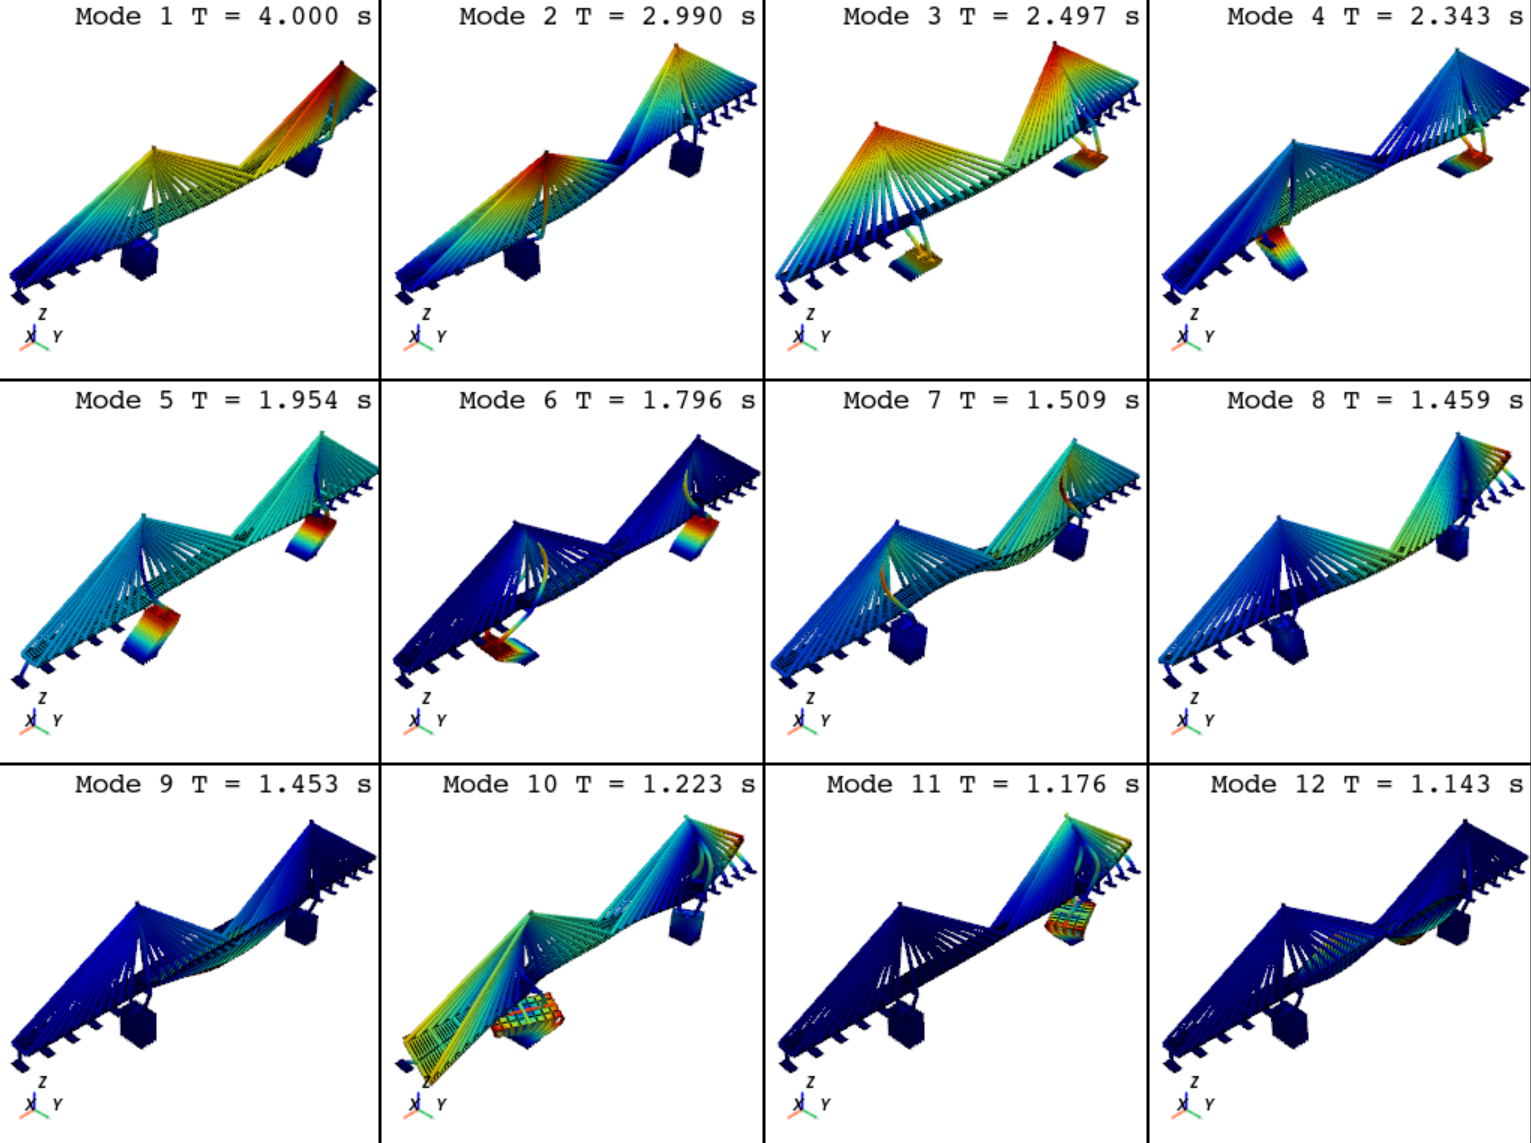
plot_eigen#
- opstool.vis.plot_eigen(mode_tags, solver='-genBandArpack', backend='pyvista', point_size=1, line_width=3, on_notebook=False, subplots=False, link_views=True, alpha=1.0, show_outline=False, show_origin=False, label_size=15.0, opacity=1.0, show_face_line=True, show_cmap=True)[source]#
Fast eigen visualization.
Parameters#
- mode_tags: list[int], or tuple[int]
Mode tags to be shown, if list or tuple [mode1, mode2], display the multiple modes from mode1 to mode2.
- solver: str, default ‘-genBandArpack’
type of solver, optional ‘-genBandArpack’, ‘-fullGenLapack’, see https://openseespydoc.readthedocs.io/en/latest/src/eigen.html.
- backendstr, optional “pyvista” or “plotly”, or “matplotlib”.
Plot backend, by default “pyvista”. Note that “matplotlib” is only supported for 2D.
- point_size: float, default=1
The render size of node.
- line_width: float, default=3
The width of line element.
- on_notebook: bool, default=False
Whether work in a notebook.
- subplots: bool, default=False
If True, subplots in a figure. If False, plot in a slider style.
- link_views: bool, default=True
If True, link the views’ cameras, only usefuly when subplots is True, and backend=’pyvista’.
- alpha: float, default=1.0
Model scaling factor on existing display.
- show_outline: bool, default=True
Whether to display the axes.
- show_origin: bool, default=False
Whether to show undeformed shape.
- label_size: float, default=15
The fontsize of text labels.
- opacity: float, default=1.0
Plane and solid element transparency.
- show_face_line: bool, default=True
If True, the edges of plate and solid elements will be displayed.
- show_cmap: bool, default=True
If True, display the cloud plot, else only the deformation with single color. Only supported for backend=”matplotlib”.
Example#
import openseespy.opensees as ops
import opstool as opst

# opst.load_ops_examples("ArchBridge")
opst.load_ops_examples("CableStayedBridge")
# opst.load_ops_examples("Dam")
# opst.load_ops_examples("Frame3D")
# load_ops_examples("Igloo")
# load_ops_examples("Pier")
# opst.load_ops_examples("SuspensionBridge")

# ------------------------
# or your model code here
# ------------------------

opst.plot_model(backend="pyvista")    # or backend="plotly"
opst.plot_eigen(mode_tags=[1, 12], backend="pyvista", subplots=True) # or backend="plotly"