OpenSeesPy Model Visualization#
Currently, Module opstool.vis provides two major roles, OpenSeesPy model (including responses) visualization and
fiber section (including responses) visualization.
Before visualization, class GetFEMdata is needed to get data from the current domain of OpenSeesPy.
The class GetFEMdata automatically generates the result files in the specified output directory,
which will be read by the visualization class OpsVisPlotly, OpsVisPyvista,
and FiberSecVis.
Tip
The module opstool.vis provides two plotting backends to visualize the OpenSeesPy model, including plotly and pyvista.
The visualization classes are OpsVisPlotly and OpsVisPyvista respectively.
Plotly renders images based on the web, and pyvista is a python wrapper for the C++ visualization package VTK.
In general, plotly renders a bit slower than pyvista, but provides powerful interactivity.
The choice depends on your preference, but both have almost the same interface.
Here are some guidelines on model visualization and fiber section visualization.
Quick Model and Eigenmodes Visualization#
In addition, opstool provides functions plot_model() and plot_eigen() to quickly plot model and eigenmodes,
which can reduce your code work.
Example#
import openseespy.opensees as ops
import opstool as opst
# opst.load_ops_examples("ArchBridge")
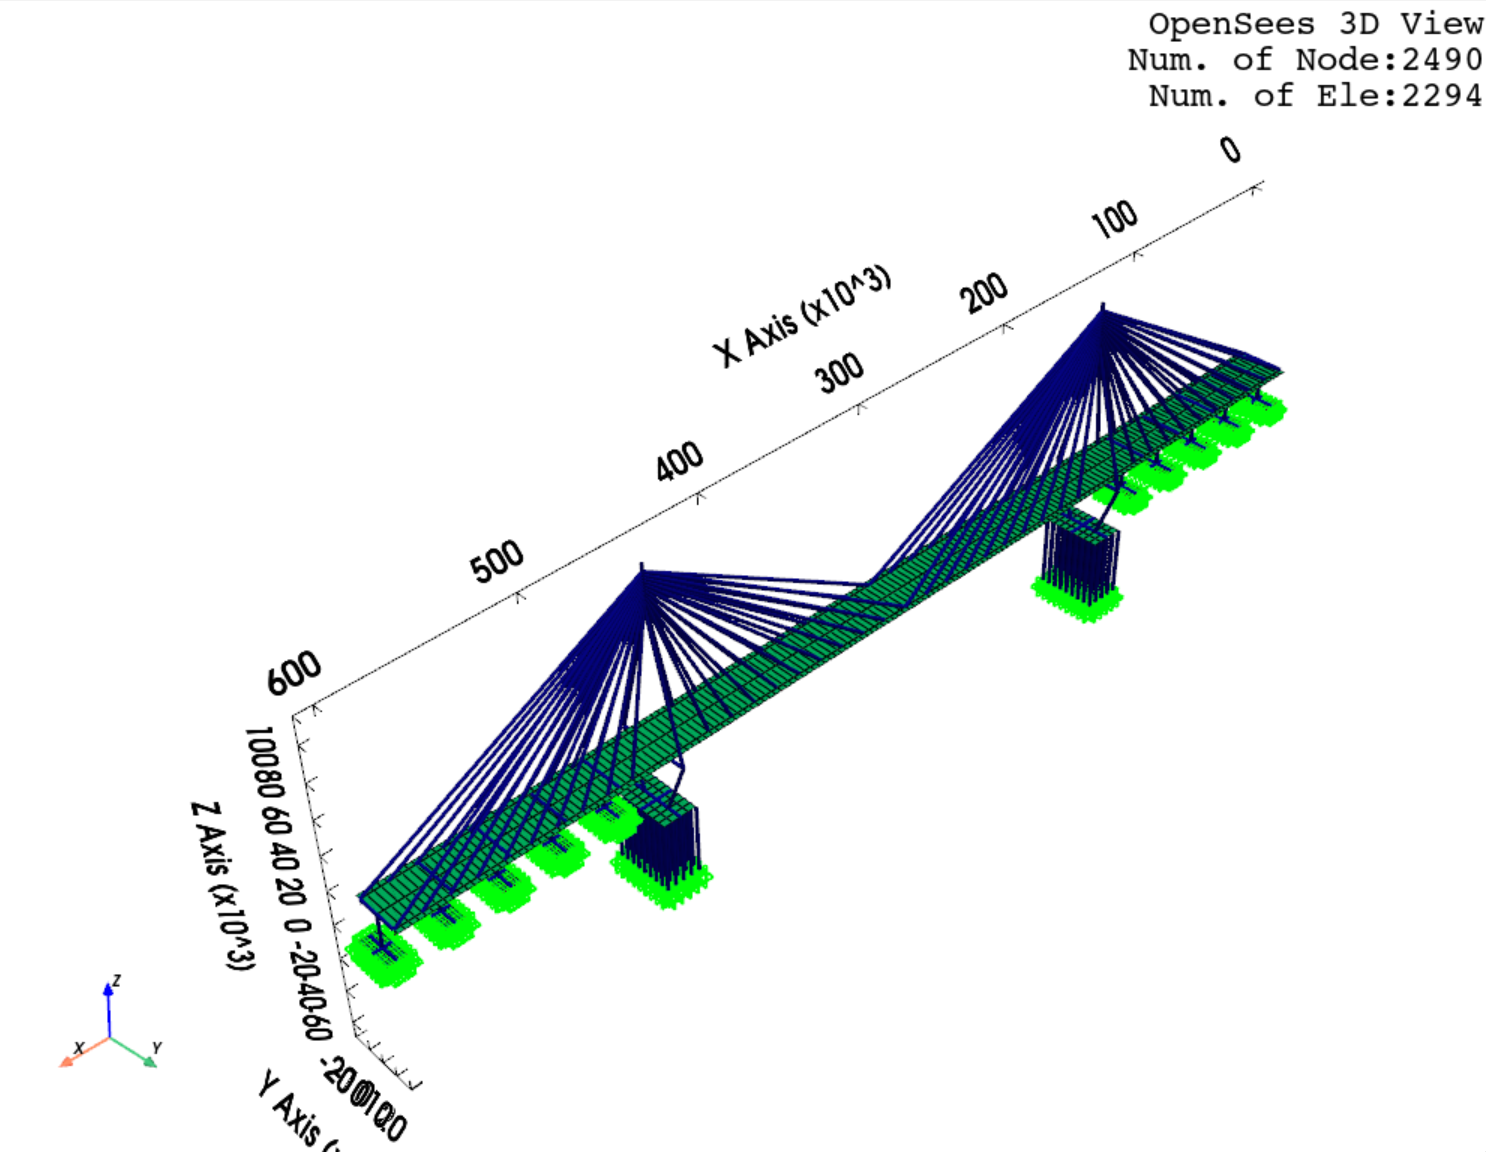
opst.load_ops_examples("CableStayedBridge")
# opst.load_ops_examples("Dam")
# opst.load_ops_examples("Frame3D")
# load_ops_examples("Igloo")
# load_ops_examples("Pier")
# opst.load_ops_examples("SuspensionBridge")
# ------------------------
# or your model code here
# ------------------------
opst.plot_model(backend="pyvista") # or backend="plotly"
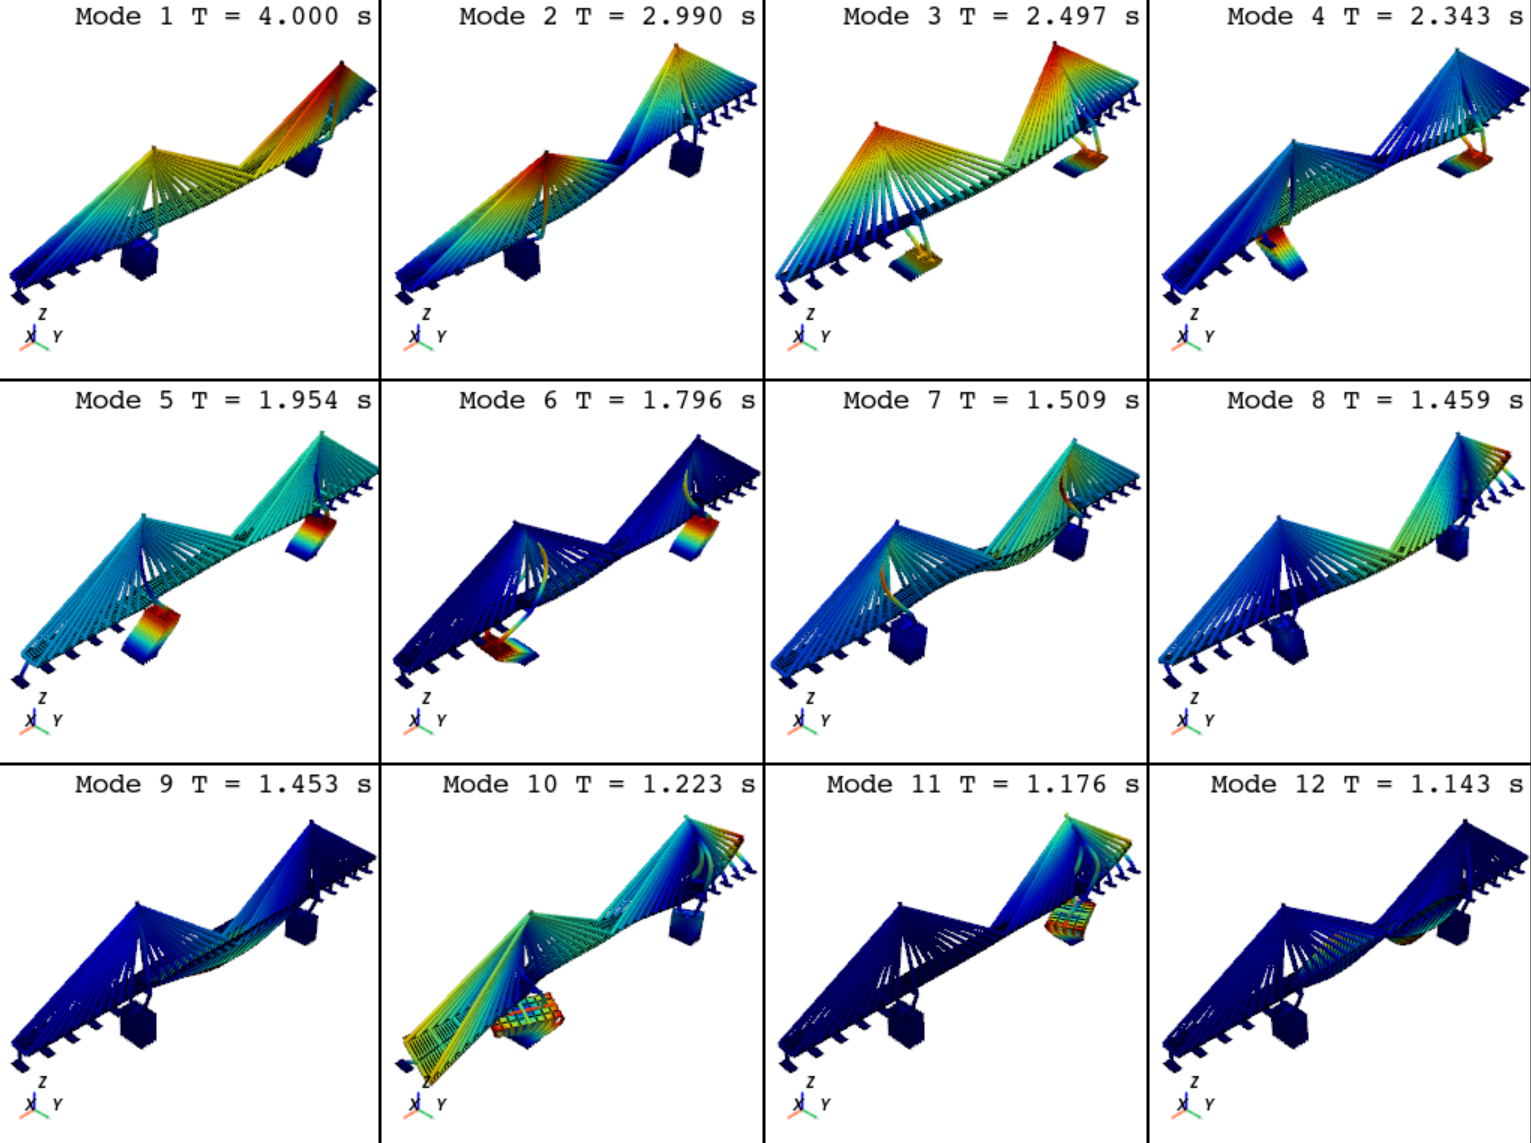
opst.plot_eigen(mode_tags=[1, 12], backend="pyvista", subplots=True) # or backend="plotly"