Fiber Section Mesh
Section mesh class
This is a main class for creating fiber section triangular mesh.
- class opstool.pre.section.FiberSecMesh(sec_name='My Section')[source]
A class to mesh the cross-section with triangular fibers.
Parameters
- sec_namestr
Assign a name to the section.
- add_patch_group(patches)[source]
Add the patches.
Parameters
- patchesdict|patch|List[patch]
A dict of name as a key, geometry obj as value.
Returns
SecMesh instance
- get_patch_group()[source]
Return the group dict for each geometry obj.
Returns
group : dict[str, any]
- set_mesh_size(mesh_size)[source]
Assign the mesh size dict for each mesh.
Parameters
- mesh_sizedict[str, float] | list[float] | float
The mesh sizes describe the maximum mesh element size to be used in the finite-element mesh for each Geometry object.
If dict, name as the key, mesh size as value.
If floated, all geoms will use the same meshsize.
If list or tuple, the length must be the same as the geoms.
Returns
instance
- set_ops_mat_tag(mat_tag)[source]
Assign the opensees mat tag for each mesh.
Parameters
- mat_tagdict[str, int] | list[int] | int
If dict, name as a key, OpenSees matTag previously defined as value.
If list or tuple, the length must be the same as the geom patches.
If int, all patches will use the same matTag.
Returns
instance
- set_mesh_color(colors)[source]
Assign the color to plot the section.
Parameters
- colorsdict[str, str] | list[str|list|tuple] | str
If dict, the patch name as a key, color as value.
- mesh()[source]
Mesh the section.
If set_mesh_size has not been invoked, the mesh size of each Geometry will be calculated by its area / 100.
Returns
None
- get_fiber_data()[source]
Return fiber data.
Returns
- Tuple(dict, dict)
fiber center dict, fiber area dict
- add_rebar_points(points, dia, ops_mat_tag=None, color='black', group_name='Rebar')[source]
Add rebars by coord points.
Parameters
- points: list[list[float, float]]
A list of rebar coords, [(x1, y1), (x2, y2),…,(xn, yn)], in which each element represents a rebar point.
- dia: float
Rebar diameter.
- ops_mat_tag: int
OpenSees mat Tag for rebar previously defined.
- color: str or rgb tuple.
Color to plot rebar.
- group_name: str, default=’Rebar’
Assign rebar group name
Returns
None
- add_rebar_line(points, dia, gap=0.1, n=None, closure=False, ops_mat_tag=None, color='black', group_name='Rebar')[source]
Add rebar along a line, can be a line or polygon.
Parameters
- points: list[list[float, float]]
A list of rebar coords, [(x1, y1), (x2, y2),…,(xn, yn)], in which each element represents a corner point, and every two corner points are divided by the arg gap.
- dia: float
Rebar diameter.
- gap: float, default=0.1
Rebar space.
- n: int, default=None
The number of rebars, if not None, update the Arg gap according to n. This means that if you know the number of rebars, you don’t need to input gap or set gap to any number.
- closure: bool, default=False
If True, the rebar line is a closed loop.
- ops_mat_tag: int
OpenSees mat Tag for rebar previously defined.
- color: str or rgb tuple.
Color to plot rebar.
- group_name: str, default=’Rebar’
Assign rebar group name
Returns
None
- add_rebar_circle(xo, radius, dia, gap=0.1, n=None, angles=(0.0, 360), ops_mat_tag=None, color='black', group_name='Rebar')[source]
Add the rebars along a circle.
Parameters
- xo: list[float, float]
Center coords of circle, [(xc, yc)].
- radius: float
Radius of circle.
- dia: float
rebar dia.
- gap: float, default=0.1
Rebar space.
- n: int, default=None
The number of rebars, if not None, update the Arg gap according to n. This means that if you know the number of rebars, you don’t need to input gap or set gap to any number.
- angles: Union[list, tuple], default=[0.0, 360]
The start angle and end angle, degree.
- ops_mat_tag: int, defaultt=None
OpenSees material matTag for rebar previously defined.
- color: str or rgb tuple.
Color to plot rebar.
- group_name: str, default=’Rebar’
Assign rebar group name.
Returns
None
- get_rebars_area()[source]
Returns the total area of rebars.
Returns
area: float, total area of rebars.
- get_area()[source]
Return section area. For a single-material section, it is the geometric area, and for a composite section, it is the equivalent area.
Returns
area: float, section area.
- get_geom_area()[source]
Return the total geometric area of a section.
Returns
area: float, section area.
- get_iy()[source]
Return Moment of inertia of the section around the y-axis.
Returns
iy: float, Moment of inertia of the section around the y-axis.
- get_iz()[source]
Return Moment of inertia of the section around the z-axis.
Returns
iz: float, Moment of inertia of the section around the z-axis.
- get_dist_from_centroid()[source]
Return the distance from section edge to the centroid.
Returns
- list, [ztop, zbot, yright, yleft]
z axis top, z axis bottom, y-axis right, y-axis left
- get_sec_props(Eref=1.0, display_results=False, fmt='8.3E', plot_centroids=False)[source]
Solving Section Geometry Properties by Finite Element Method, by
sectionpropertiespacakge. See sectionproperties resultsThis command may be slower. If you don’t need features such as shear area, you can use method
get_frame_props().Parameters
- Eref: float, default=1.0
Reference modulus of elasticity, it is important to analyze the composite section. If it is not a composite section, please ignore this parameter.
- display_resultsbool, default=True
whether to display the results.
- fmtstr, optional
Number formatting string when display_results=True.
- plot_centroidsbool, default=False
whether to plot centroids.
Returns
- sec_props: dict
section props dict, including:
Cross-sectional area (A)
Shear area (Asy, Asz)
Elastic centroid (centroid)
Second moments of area about the centroidal axis (Iy, Iz, Iyz)
Elastic section moduli about the centroidal axis with respect to the top and bottom fibres (Wyt, Wyb, Wzt, Wzb)
Torsion constant (J)
Principal axis angle (phi)
Section mass (mass), only true if material density is defined, otherwise geometric area (mass density is 1)
ratio of reinforcement (rho_rebar)
Note
If it is not a composite section, please ignore the Eref parameter; Otherwise, please use the Eref parameter, all section properties will be transformed according to the reference material, and the mechanical properties of the reference material are then used in the practical analysis.
Note that according to the OpenSees convention, the x-axis refers to the normal direction of the section, the y-axis refers to the abscissa, and the z-axis refers to the ordinate direction.
- get_frame_props(Eref=1.0, display_results=False, fmt='8.3E')[source]
Calculates and returns the properties required for a frame analysis. See sectionproperties frame_properties
This method is fast, but cannot calculate the shear area compared to the method
get_sec_props().Parameters
- Eref: float, default=1.0
Reference modulus of elasticity, it is important to analyze the composite section. If it is not a composite section, please ignore this parameter. See https://sectionproperties.readthedocs.io/en/latest/user_guide/results.html#label-material-affects-results
- display_resultsbool, default=True
whether to display the results.
- fmtstr, optional
Number formatting string when display_results=True.
Returns
- sec_props: dict
section props dict, including:
Cross-sectional area (A)
Elastic centroid (centroid)
Second moments of area about the centroidal axis (Iy, Iz, Iyz)
Elastic section moduli about the centroidal axis with respect to the top and bottom fibers (Wyt, Wyb, Wzt, Wzb)
Torsion constant (J)
Principal axis angle (phi)
Section mass (mass), only true if material density is defined, otherwise geometric area (mass density is 1)
ratio of reinforcement (rho_rebar)
Note
If it is not a composite section, please ignore the Eref parameter; Otherwise, please use the Eref parameter, all section properties will be transformed according to the reference material, and the mechanical properties of the reference material are then used in the practical analysis.
Note that according to the OpenSees convention, the x-axis refers to the normal direction of the section, the y-axis refers to the abscissa, and the z-axis refers to the ordinate direction.
- display_all_results(Eref=1.0, fmt='8.6e')[source]
Prints all results that have been calculated by
sectionpropertiesto the terminal.Parameters
- Eref: float, default=1.0
Reference modulus of elasticity, it is important to analyze the composite section. If it is not a composite section, please ignore this parameter. See sectionproperties document
- fmtstr, optional
Number formatting string.
- get_stress(N=0, Vy=0, Vz=0, Myy=0, Mzz=0, Mxx=0, plot_stress='all', cmap='YlOrBr', normalize=False, fmt='{x:.4e}', colorbar_label='Stress', alpha=0.75, **kargs)[source]
Calculates the cross-section stress resulting from design actions and returns a list of dictionaries containing the cross-section stresses for each region by method
assign_group().Note
This function is only available for elastic stress analysis, and reinforcement is ignored. The stresses are realistic only if you specify the correct material for each geometry region.
Parameters
- Nfloat, optional
Axial force, by default 0
- Vyfloat, optional
Shear force acting in the y-direction, by default 0
- Vzfloat, optional
Shear force acting in the z-direction, by default 0
- Myyfloat, optional
Bending moment about the centroidal yy-axis, by default 0
- Mzzfloat, optional
Bending moment about the centroidal zz-axis, by default 0
- Mxxfloat, optional
Torsion moment about the centroidal xx-axis, by default 0
- plot_stressstr, optional
plot the various cross-section stresses, by default None. Note that according to the OpenSees convention, the x-axis refers to the normal direction of the section, the y-axis refers to the abscissa, and the z-axis refers to the ordinate direction. Optional as follows (if plot_stress=”all”, will plot all stress types):
Combined Stress Plots:
“xx”–combined normal stress resulting from all actions;
“xy”–y-component of the shear stress resulting from all actions;
“xz”– z-component of the shear stress resulting from all actions;
“xyz”–resultant shear stress resulting from all actions;
“p1”–major principal stress resulting from all actions;
“p3”– Minor principal stress resulting from all actions;
“vm”–von Mises stress resulting from all actions;
Primary Stress Plots:
“n_xx”–normal stress resulting from the axial load N;
“myy_xx”–normal stress resulting from the bending moment Myy;
“mzz_xx”–normal stress resulting from the bending moment Mzz;
“m_xx”–normal stress resulting from all bending moments Myy+Mzz;
“mxx_xy”–y-component of the shear stress resulting from the torsion moment Mxx;
“mxx_xz”–z-component of the shear stress resulting from the torsion moment Mxx;
“mxx_xyz”–resultant shear stress resulting from the torsion moment Mxx;
“vy_xy”–y-component of the shear stress resulting from the shear force Vy;
“vy_xz”–z-component of the shear stress resulting from the shear force Vy;
“vy_xyz”–resultant shear stress resulting from the shear force Vy;
“vz_xy”–y-component of the shear stress resulting from the shear force Vz;
“vz_xz”–z-component of the shear stress resulting from the shear force Vz;
“vz_xyz”–resultant shear stress resulting from the shear force Vz;
“v_xy”–y-component of the shear stress resulting from the sum of the applied shear forces Vy+Vz;
“v_xz”–z-component of the shear stress resulting from the sum of the applied shear forces Vy+Vz;
“v_xyz”–resultant shear stress resulting from the sum of the applied shear forces Vy+Vz;
- cmapstr, optional
Matplotlib color map, by default ‘coolwarm’
- normalizebool, optional
If set to true, the CenteredNorm is used to scale the colormap. If set to false, the default linear scaling is used., by default True
- fmt: str
Number formatting string, see here
- colorbar_label: str, default=’Stress’
Colorbar label
- alpha: float, default=0.75
Transparency of the mesh outlines
Returns
- list[dict]:
A list of dictionaries containing the cross-section stresses for each region by method
assign_group().
- rotate(theta=0)[source]
Rotate the section clockwise.
Parameters
- thetafloat, default=0
Rotation angle, unit: degree.
Returns
None
- to_opspy_cmds(secTag, GJ=None, G=None)[source]
Generate openseespy fiber section command.
Parameters
- secTagint
The section tag assigned in OpenSees.
- GJ: float, default = None
Torsion stiffness. Note that at least one of GJ and G needs to be specified, and if both, it will be calculated by GJ.
- G: float, default = None
Shear modulus. The program automatically calculates the torsion constant. Note that at least one of GJ and G needs to be specified, and if both, it will be calculated by GJ.
Returns
None
- to_file(output_path, secTag, GJ=None, G=None, fmt=':.6E')[source]
Output the opensees fiber code to file.
Parameters
- output_pathstr
The filepath to save, e.g., r “my_dir/my_section.py”
Note
Notes that output_path must be endswith
.pyor.tcl, function will create the file by the right style.- secTagint
The section tag assigned in OpenSees.
- GJ: float, default = None
Torsion stiffness. Note that at least one of GJ and G needs to be specified, and if both, it will be calculated by GJ.
- G: float, default = None
Shear modulus. The program automatically calculates the torsion constant. Note that at least one of GJ and G needs to be specified, and if both, it will be calculated by GJ.
- fmtstr, default = “:.6E”
Formatting style for floating point numbers.
Returns
None
- opstool.pre.section.SecMesh
alias of
FiberSecMesh
Utility functions for creating geometry and materials
- opstool.pre.section.create_material(name='default', elastic_modulus=1.0, poissons_ratio=0.0, yield_strength=1.0, density=1.0, color='w')[source]
Create a meterial object of sectionproperties material.
Parameters
- namestr, default=’default’
meterial name.
- elastic_modulusfloat, default==1
elastic_modulus.
- poissons_ratiofloat, default=0
poissons_ratio
- yield_strengthfloat, default==1
yield_strength
- densityfloat, default=1
mass density
- color: str, default=’w’
plot color by
sectionproperties.
Returns
- opstool.pre.section.create_polygon_patch(outline, holes=None, material=None)[source]
Add a polygon plane geom object.
Parameters
- outlinelist[list[float, float]]
The coords list of polygon points, [(x1, y1), (x2, y2),…,(xn, yn)]
- holes: list[list[list[float, float]]].
Hole of the section, a list of multiple hole coords, [hole1, hole2,…holeN], holeN=[(x1, y1), (x2, y2),…,(xn, yn)].
- material: material obj
The instance from
opstool.pre.section.create_material()
Returns
polygon geom obj
- opstool.pre.section.create_circle_patch(xo, radius, holes=None, angle1=0.0, angle2=360, n_sub=40, material=None)[source]
Add the circle geom obj.
Parameters
- xolist[float, float]
Center coords, [(xc, yc)].
- radius: float
radius.
- holes: list[list[list[float, float]]].
Hole of the section, a list of multiple hole coords, [hole1, hole2,…holeN], holeN=[(x1, y1), (x2, y2),…,(xn, yn)].
- angle1float
The start angle, degree
- angle2float
The end angle, deree
- n_sub: int
The partition number of the perimeter.
- material: material obj
The instance from
opstool.pre.section.create_material().
Returns
Cirle geom obj.
- opstool.pre.section.create_patch_from_dxf(filepath, spline_delta=0.1, degrees_per_segment=1)[source]
An interface for the creation of Geometry objects from CAD .dxf files. See sectionproperties docs.
Parameters
- filepath: str|path
A path-like object for the dxf file.
- spline_delta: float, default = 0.1
Splines are not supported in shapely, so they are approximated as polylines, this argument affects the spline sampling rate.
- degrees_per_segment: float, default = 1
The number of degrees discretized as a single line segment.
Returns
geom obj.
- opstool.pre.section.create_circle_points(xo, radius, angles=(0.0, 360), n_sub=40)[source]
Add the circle geom obj.
Parameters
- xolist[float, float]
Center coords, [(xc, yc)].
- radius: float
radius.
- anglesUnion[list, tuple], default=(0.0, 360)
The start angle and the end angle, deree
- n_sub: int, default=40
The partition number of the perimeter.
Returns
- points: list[list[float, float]]
coord points on arc line.
- opstool.pre.section.offset(points, d)[source]
Offsets closed polygons.
Parameters
- pointslist[list[float, float]]
A list containing the coordinate points, [(x1, y1),(x2, y2),…,(xn.yn)].
- dfloat
Offsets closed polygons, positive values offset inwards, negative values outwards.
Returns
coords: list[[float, float]], new offset points.
Examples
>>> import opstool as opst
>>> outlines1 = [[0, 0], [0, 1], [1, 1]]
>>> outlines2 = opst.pre.section.offset(outlines1, d=0.1)
>>> outlines3 = [[0, 0], [0, 1], [1, 1], [1, 0]]
>>> outlines4 = opst.pre.section.offset(outlines3, d=0.1)
- opstool.pre.section.line_offset(points, d)[source]
Offset a distance from a non-closed line ring on its right or its left side.
Parameters
- pointslist[list[float, float]]
A list containing the coordinate points, [(x1, y1),(x2, y2),…,(xn.yn)].
- dfloat
Offsets non-closed line ring, negative for left side offset, positive for right side offset.
Returns
coords: list[[float, float]]
Examples
>>> import opstool as opst
>>> lines = [[0, 0], [0, 1]]
>>> lines2 = opst.pre.section.line_offset(lines, d=0.1)
>>> lines = [[0, 0], [0, 1], [1, 1]]
>>> lines3 = opst.pre.section.line_offset(lines, d=0.1)
>>> lines = [[0, 0], [0, 1], [1, 0]]
>>> lines4 = opst.pre.section.line_offset(lines, d=0.1)
- opstool.pre.section.poly_offset(points, d)[source]
Offsets closed polygons, same as
opstool.pre.section.offset()Parameters
- pointslist[list[float, float]]
A list containing the coordinate points, [(x1, y1),(x2, y2),…,(xn.yn)].
- dfloat
Offsets closed polygons, positive values offset inwards, negative values outwards.
Returns
coords: list[[float, float]]
- opstool.pre.section.set_patch_material(geom, material=Material(name='default', elastic_modulus=1, poissons_ratio=0, yield_strength=1, density=1, color='w'))[source]
Assign material to a geom patch.
Parameters
- geom: geom obj | list[geom obj]
The geometry object.
- material: material obj | list[material obj]
The material object of
opstool.pre.section.create_material().
- opstool.pre.section.vis_fiber_sec_real(ele_tag, sec_num=1, color=None, show_matTag=False, highlight_matTag=None, highlight_color='k', ax=None)[source]
Visualizing the actual fiber section data, where only the fiber center coordinates and areas are demonstrated, represents the data used in analysis.
Note
This is applicable for 3D only and not for 2D!
Parameters
- ele_tagint
The element ID to which the section belongs, for display purposes.
- sec_numint
The section at which Gauss points to display, numbered starting from 1, from i to segment j.
- color: str, optional
Defaults to gradient colors, varying based on the distance to the section’s center point.
- show_matTagbool, optional
Whether to show the material tag on the fiber. Defaults to False.
- highlight_matTagfloat or list of floats
The material tag to highlight, if any. Defaults to None. If listed, then highlight all the materials in the list.
- highlight_colorstr or array-like, optional
Color for highlight_matTag. Defaults to gradient colors, varying based on the distance to the section’s center point.
- axmatplotlib.axes.Axes, optional
The axes to plot the section. Defaults to None.
Wrapper for OpenSeesPy section commands
The following commands wrap the fiber section-related commands in OpenSeesPy.
These commands retain the same functionality as the original commands but additionally save
the user-provided input data for purposes such as visualization.
- opstool.pre.section.section(*args)[source]
argssee section command
- opstool.pre.section.fiber(*args)[source]
argssee fiber command
- opstool.pre.section.patch(*args)[source]
argssee patch command
- opstool.pre.section.layer(*args)[source]
argssee layer command
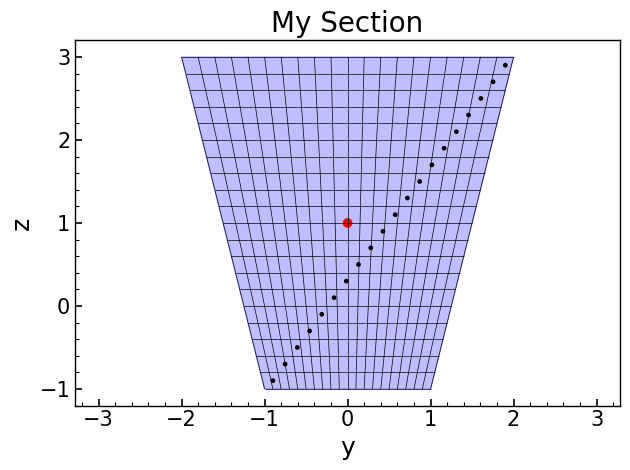
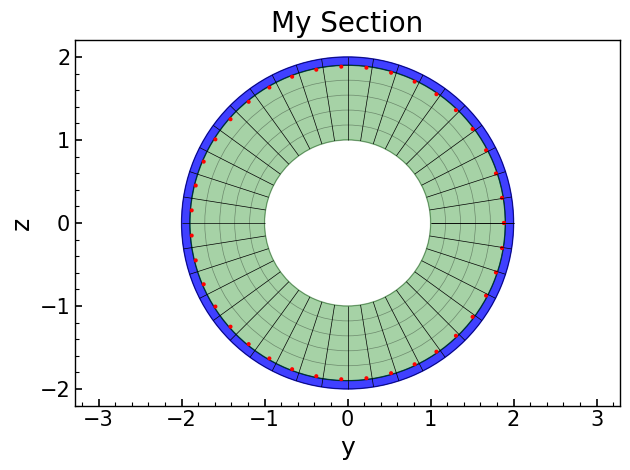
- opstool.pre.section.plot_fiber_sec_cmds(sec_tag, title='My Section', label_size=18, tick_size=15, title_size=20)[source]
Plot the fiber section by section tag.
Parameters
- sec_tagint
section tag in the
OpenSeesPydomain.- titlestr, optional
Title of plot, by default “My Section”
- label_sizeint, optional
Axis label size, by default 18
- tick_sizeint, optional
Axis tick size, by default 15
- title_sizeint, optional
Title size, by default 20
Example
import numpy as np
import openseespy.opensees as ops
import opstool as opst

ops.wipe()
ops.model("basic", "-ndm", 3, "-ndf", 6)
ops.uniaxialMaterial("Elastic", 1, 1000)
The following commands, like those in OpenSeesPy, create objects in the domain.
sectag = 1
opst.pre.section.section("Fiber", sectag, "-GJ", 1.0e6)
opst.pre.section.patch("circ", 1, 40, 1, 0, 0, 1.9, 2, 0, 360, color="blue", opacity=0.75)
opst.pre.section.patch("circ", 1, 40, 5, 0, 0, 1, 1.9, 0, 360, color="green", opacity=0.35)
opst.pre.section.layer("circ", 1, 40, np.pi * 0.016**2, 0, 0, 1.9 - 0.016, 0.0, 360.0, color="red")
# plot
opst.pre.section.plot_fiber_sec_cmds(sec_tag=1)
Let’s look at another example.
sectag = 2
opst.pre.section.section("Fiber", sectag, "-GJ", 1.0e6)
opst.pre.section.patch("quad", 1, 20, 20, -1, -1, 1, -1, 2, 3, -2, 3, color="blue", opacity=0.25)
opst.pre.section.layer(
    "straight", 1, 20, np.pi * 0.02**2, *[-0.9, -0.9], *[1.9, 2.9], color="black"
)
opst.pre.section.fiber(0, 1, np.pi * 0.05**2, 1, color="red")
# plot
opst.pre.section.plot_fiber_sec_cmds(sec_tag=2)