Visualization
The opstool currently offers two engines for visualizing models and responses, each with its own strengths and weaknesses. Both engines are custom-tailored to provide nearly identical visualization functionalities for OpenSeesPy.
Visualization Based on Plotly
Refer to the module opstool.vis.plotly module for details.


Visualization Based on PyVista
Refer to the module opstool.vis.pyvista module for details.


A double-edged sword
-
Advantages:
Excellent for high-quality 3D rendering and visualization of complex geometries.
Built on top of VTK, making it powerful for advanced mesh analysis.
Extensive support for various mesh types and integration with computational geometry workflows.
Fast rendering speed and low memory demand.
Disadvantages:
Limited interactivity compared to web-based solutions.
-
Advantages:
Interactive and web-ready, making it ideal for sharing visualizations in dashboards or reports.
Produces visually appealing and refined graphics.
Disadvantages:
Slower rendering speed and higher memory demand compared to PyVista.
Less specialized for detailed 3D mesh analysis and complex geometry rendering.
Tip
In Plotly, only surface rendering is supported. As a result, solid elements like tetrahedra and hexahedra are visualized using triangulated meshes, meaning that Plotly does not natively support solid meshes as PyVista does.
Important
If your model is large or you are demonstrating a dynamic analysis with a very large number of steps,
do not use Plotly’s slide module or attempt to create animations, as it will be extremely slow.
Ensure that slides=False.
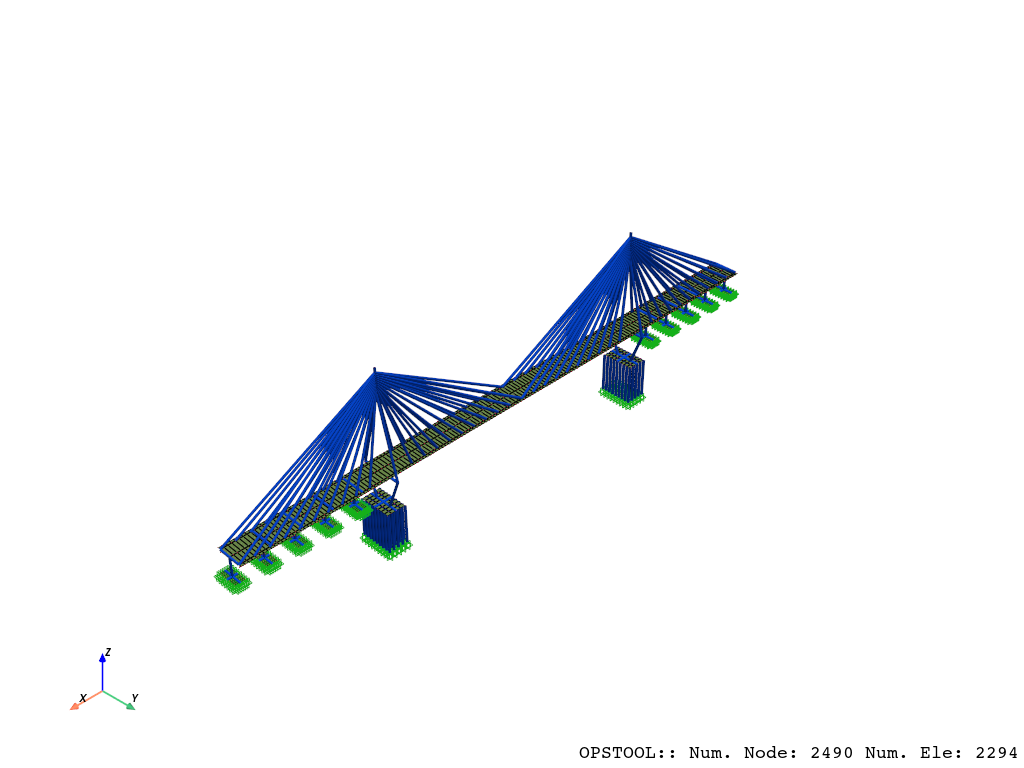
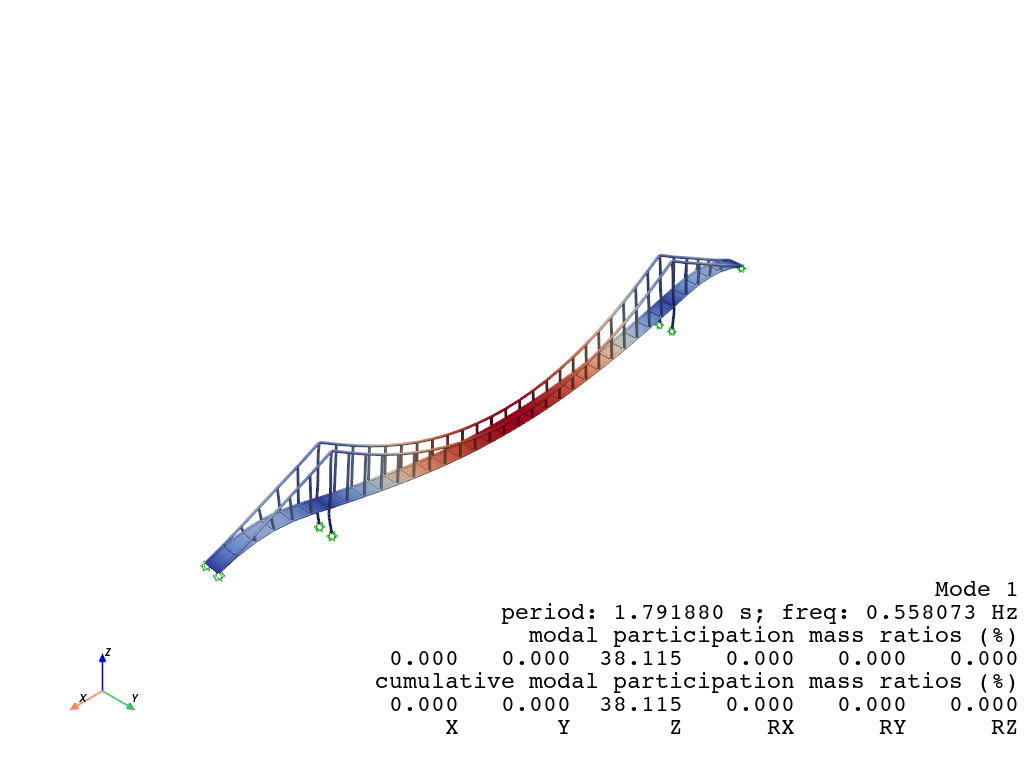
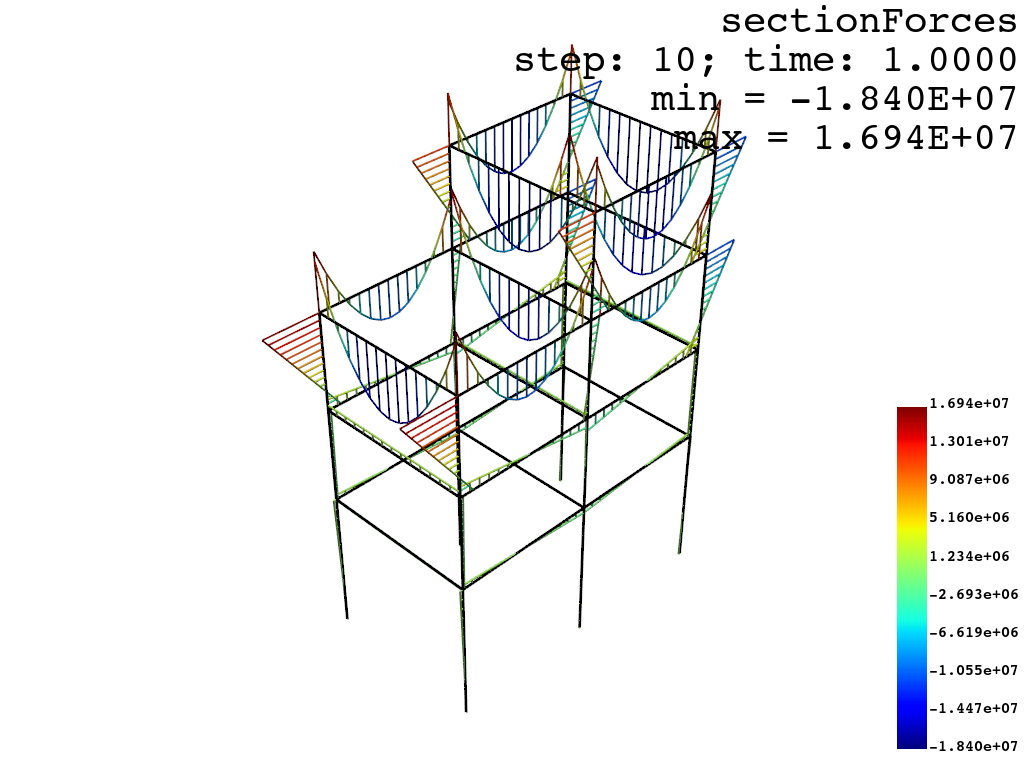
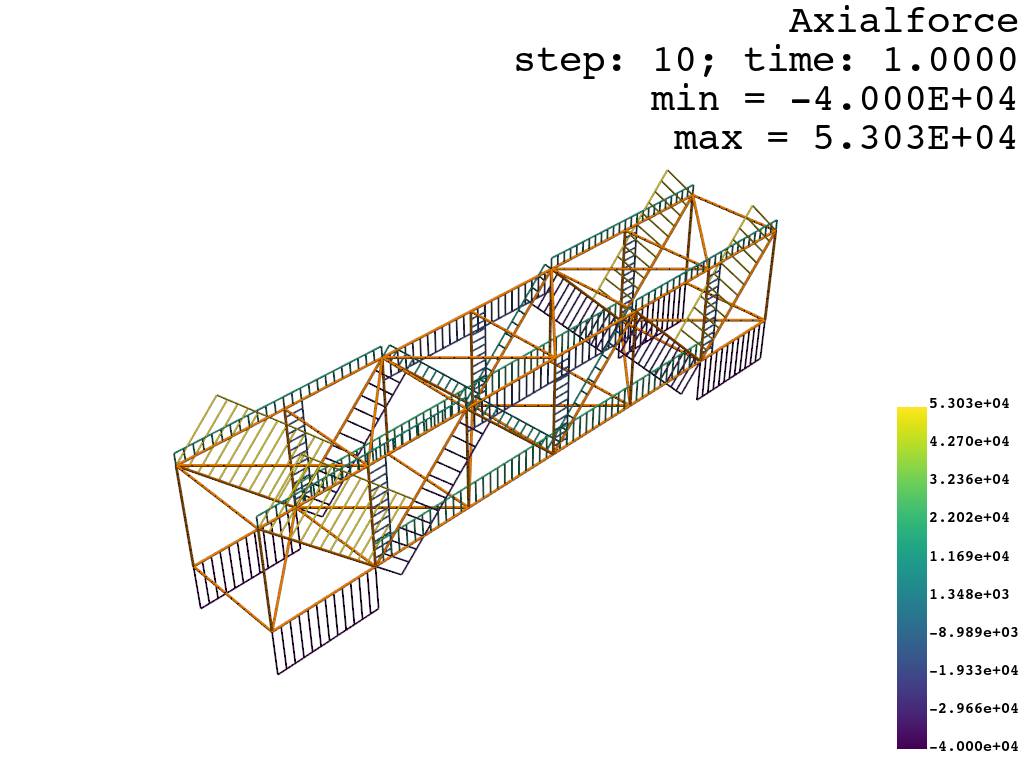
With these two engines, opstool ensures flexibility and robust visualization options
tailored for OpenSeesPy users, enabling effective analysis and presentation of structural models and
simulation results.