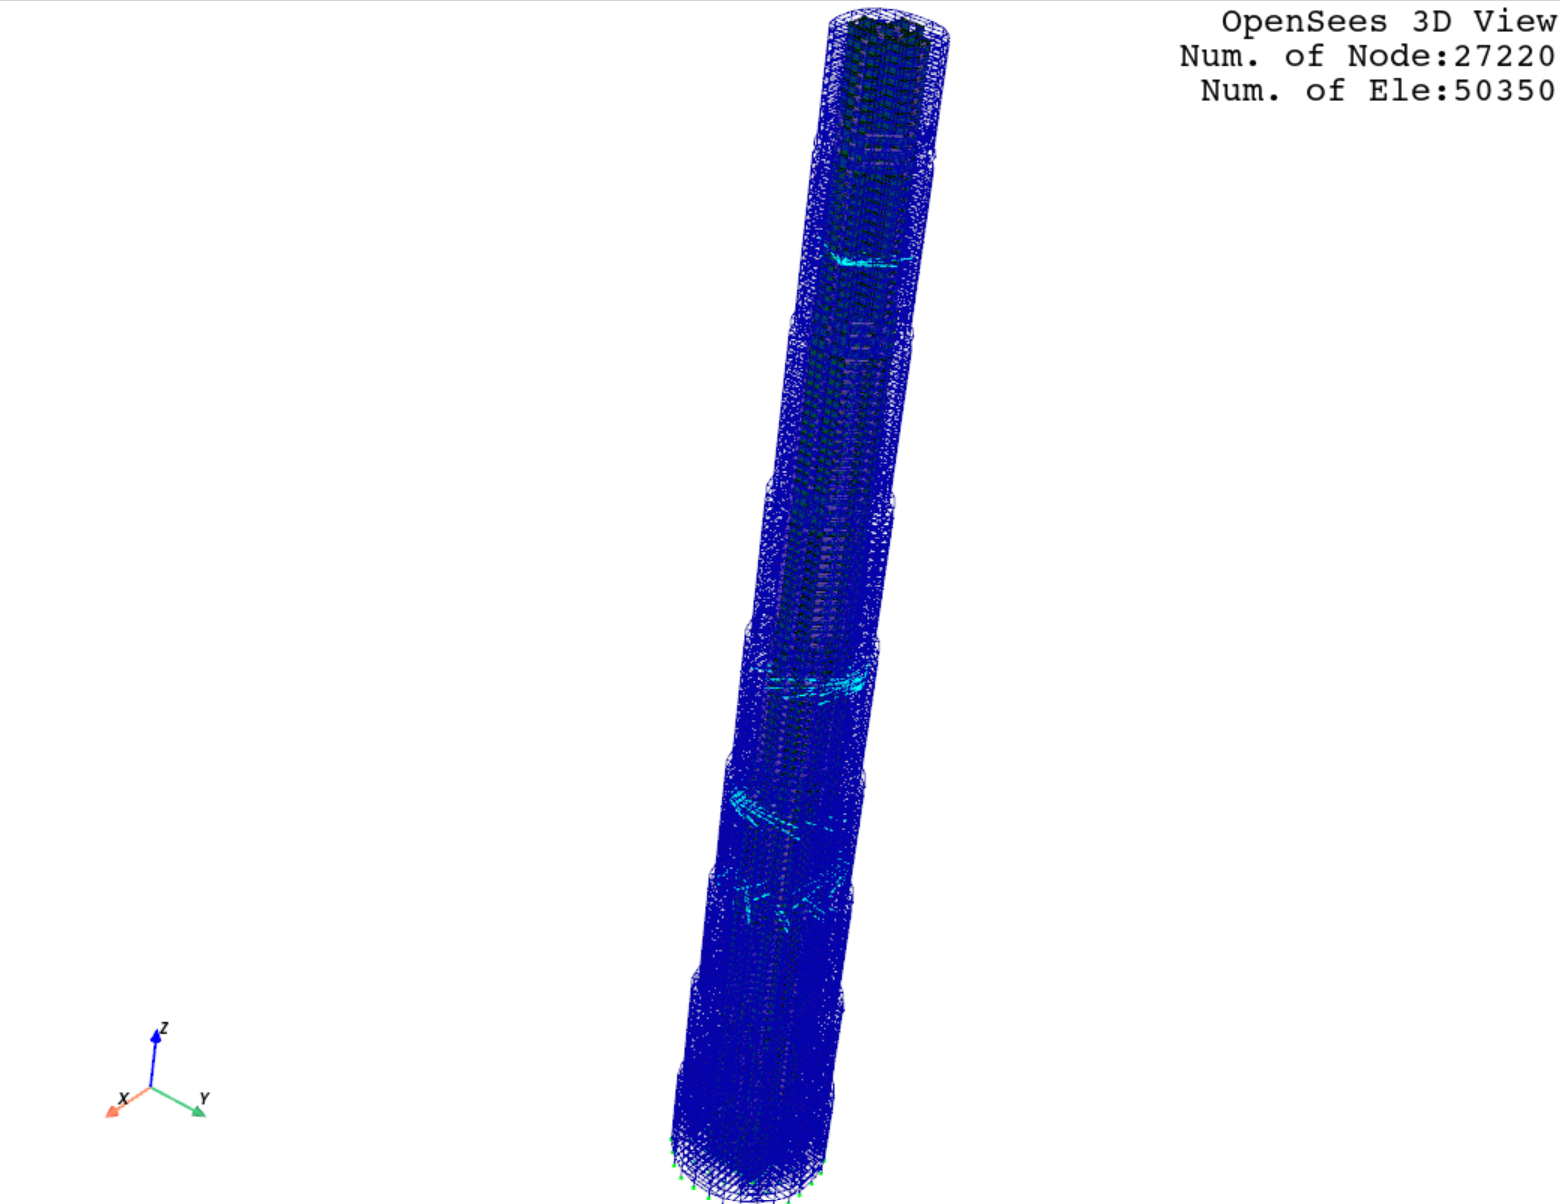
606 m Mega-tall Building#
See the original tcl file of the model in OpenSees models for a 606 m Mega-tall Building,
and a py file converted by opstool.preprocessing.tcl2py() that you can download from here
https://ln5.sync.com/dl/9e3582d40/2s3k7ayf-e52anp3t-mjfa89vz-jc427xsb named MegatallBuilding.py.
import opstool as opst
from MegatallBuilding import *
opst.plot_model(backend="pyvista", point_size=0.1, line_width=0.5)