Fast model and eigenvalue visualization#
opstool provides functions plot_model and plot_eigen to quickly plot model and eigenmodes.
plot_model#
- opstool.vis.plot_model(backend='pyvista', point_size=1, line_width=3, colors_dict=None, on_notebook=False, show_node_label=False, show_ele_label=False, show_local_crd=False, show_fix_node=True, show_constrain_dof=False, label_size=8, show_outline=True, opacity=1.0)[source]#
Plot model quickly.
Parameters#
- backendstr, optional “pyvista” or “plotly”
Plot backend, by default “pyvista”
- point_size: float, default=1
The render size of node.
- line_width: float, default=3
The width of line element.
- colors_dict: dict,
The dict for ele color, default color you can see by the class attribute
default_colors.- on_notebook: bool, default=False
Whether work in a notebook.
- show_node_label: bool, default=False
Whether to display the node label.
- show_ele_label: bool, default=False
Whether to display the ele label.
- show_local_crd: bool, default=False
Whether to display the local axes of beam and link elements.
- show_fix_node: bool, default=True
Whether to display the fix nodes.
- show_constrain_dof: bool, default=False
Whether to display labels for constrained degrees of freedom.
- label_size: float, default=8
The foontsize of node and ele label.
- show_outline: bool, default=True
Whether to show the axis frame.
- opacity: float, default=1.0
Plane and solid element transparency.
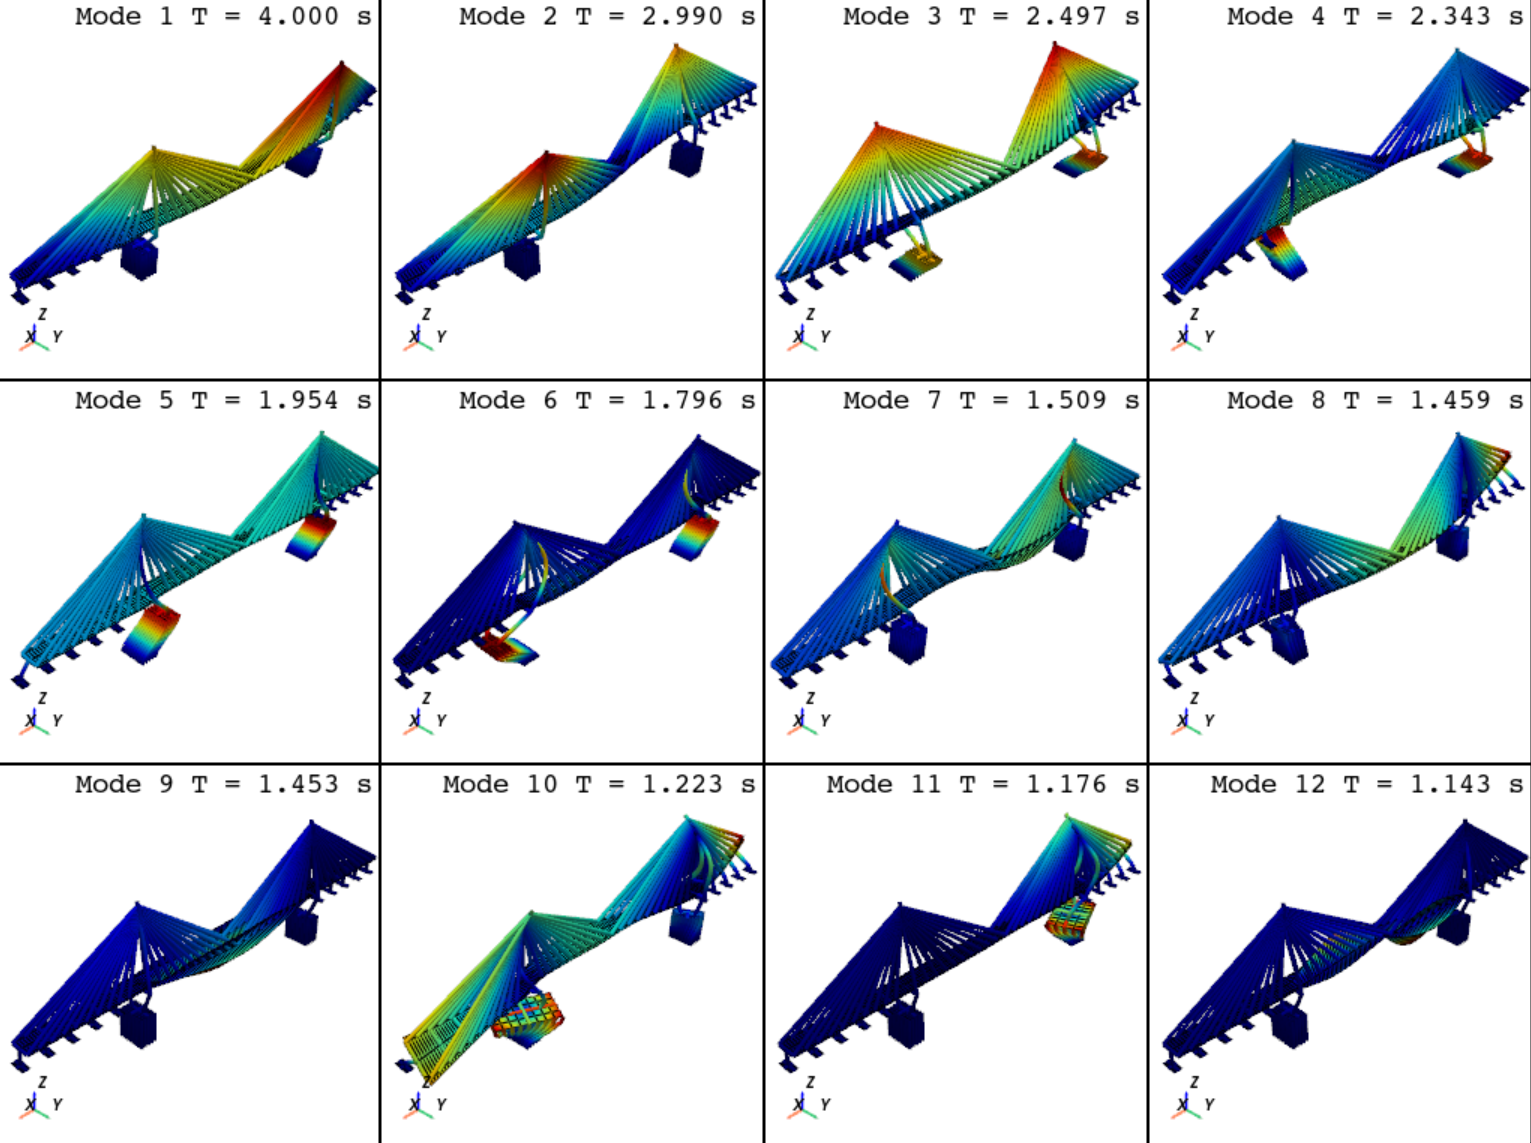
plot_eigen#
- opstool.vis.plot_eigen(mode_tags, solver='-genBandArpack', backend='pyvista', point_size=1, line_width=3, on_notebook=False, subplots=False, link_views=True, alpha=None, show_outline=False, show_origin=False, opacity=1.0, show_face_line=True)[source]#
Fast eigen visualization.
Parameters#
- mode_tags: list[int], or tuple[int]
Mode tags to be shown, if list or tuple [mode1, mode2], display the multiple modes from mode1 to mode2.
- solver: str, default ‘-genBandArpack’
type of solver, optional ‘-genBandArpack’, ‘-fullGenLapack’, see https://openseespydoc.readthedocs.io/en/latest/src/eigen.html.
- backendstr, optional “pyvista” or “plotly”
Plot backend, by default “pyvista”
- point_size: float, default=1
The render size of node.
- line_width: float, default=3
The width of line element.
- on_notebook: bool, default=False
Whether work in a notebook.
- subplots: bool, default=False
If True, subplots in a figure. If False, plot in a slider style.
- link_views: bool, default=True
If True, link the views’ cameras, only usefuly when subplots is True, and backend=’pyvista’.
- alpha: float, default=None
Model scaling factor, the default value is 1/5 of the model boundary according to the maximum deformation.
- show_outline: bool, default=True
Whether to display the axes.
- show_origin: bool, default=False
Whether to show undeformed shape.
- opacity: float, default=1.0
Plane and solid element transparency.
- show_face_line: bool, default=True
If True, the edges of plate and solid elements will be displayed.
Example#
import openseespy.opensees as ops
import opstool as opst

# opst.load_ops_examples("ArchBridge")
opst.load_ops_examples("CableStayedBridge")
# opst.load_ops_examples("Dam")
# opst.load_ops_examples("Frame3D")
# load_ops_examples("Igloo")
# load_ops_examples("Pier")
# opst.load_ops_examples("SuspensionBridge")

# ------------------------
# or your model code here
# ------------------------

opst.plot_model(backend="pyvista")    # or backend="plotly"

opst.plot_eigen(mode_tags=[1, 12], backend="pyvista", subplots=True) # or backend="plotly"